GSOPP and Growth
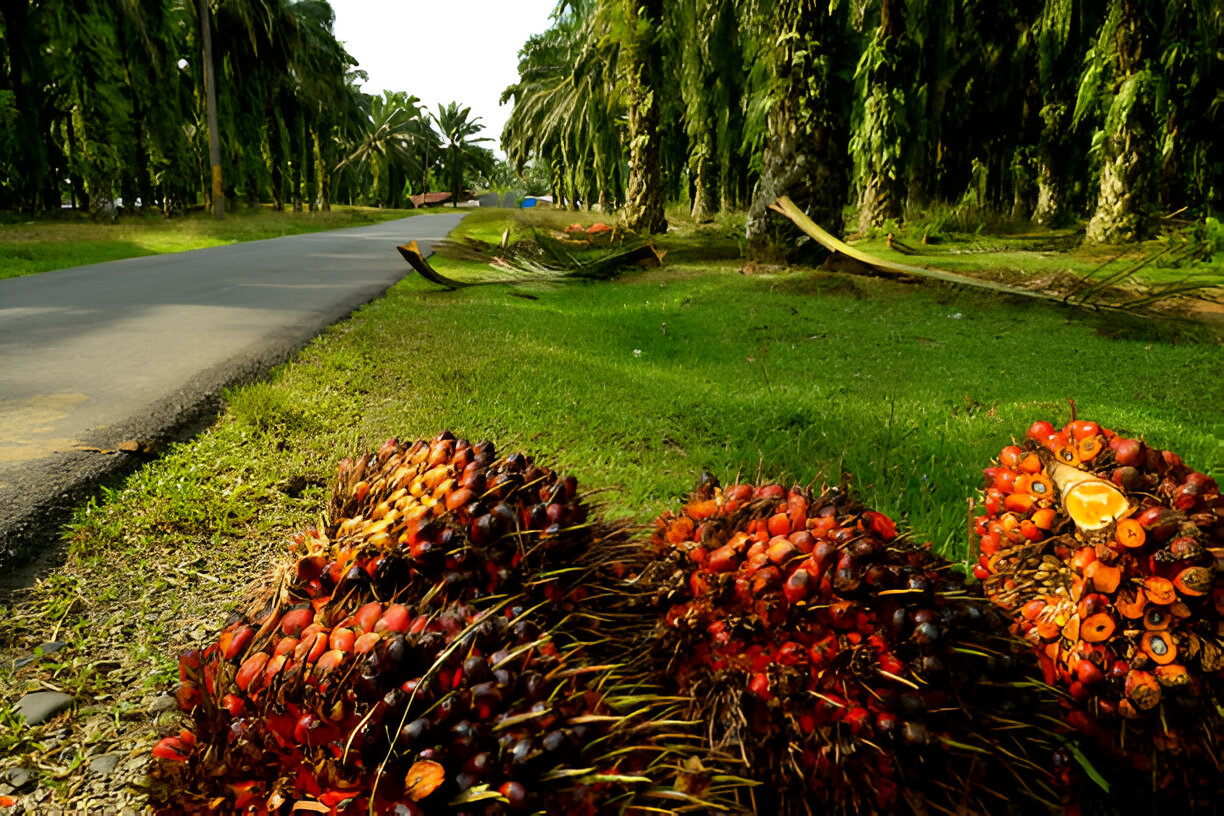
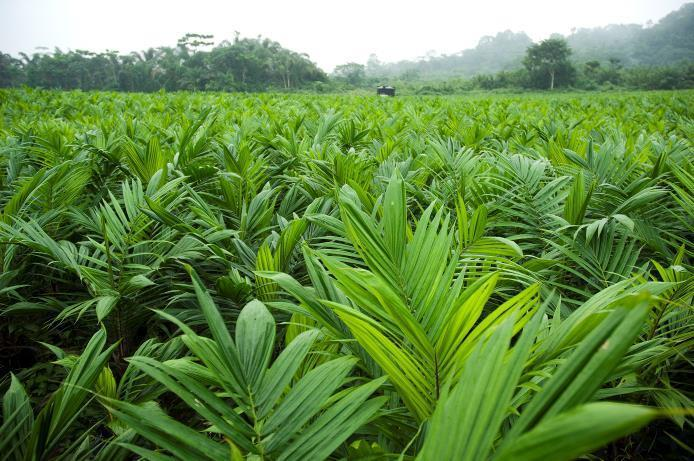
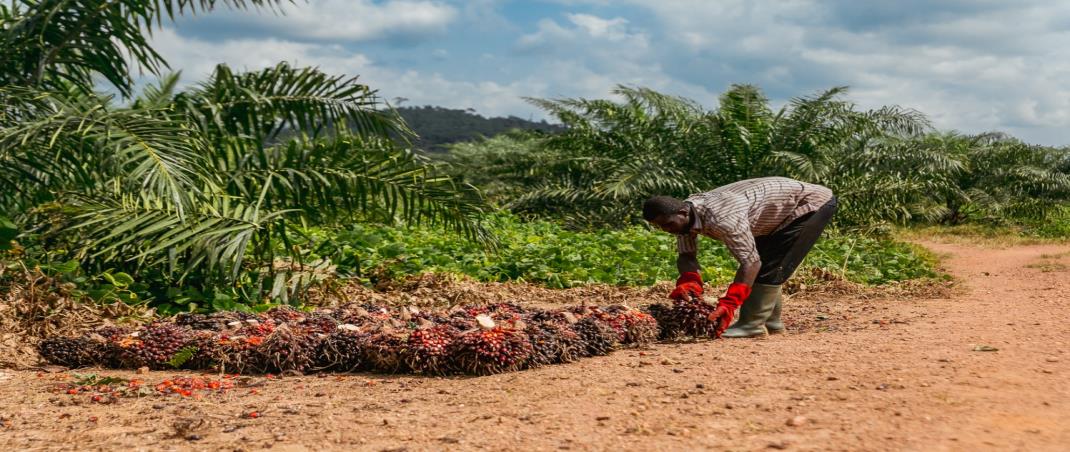
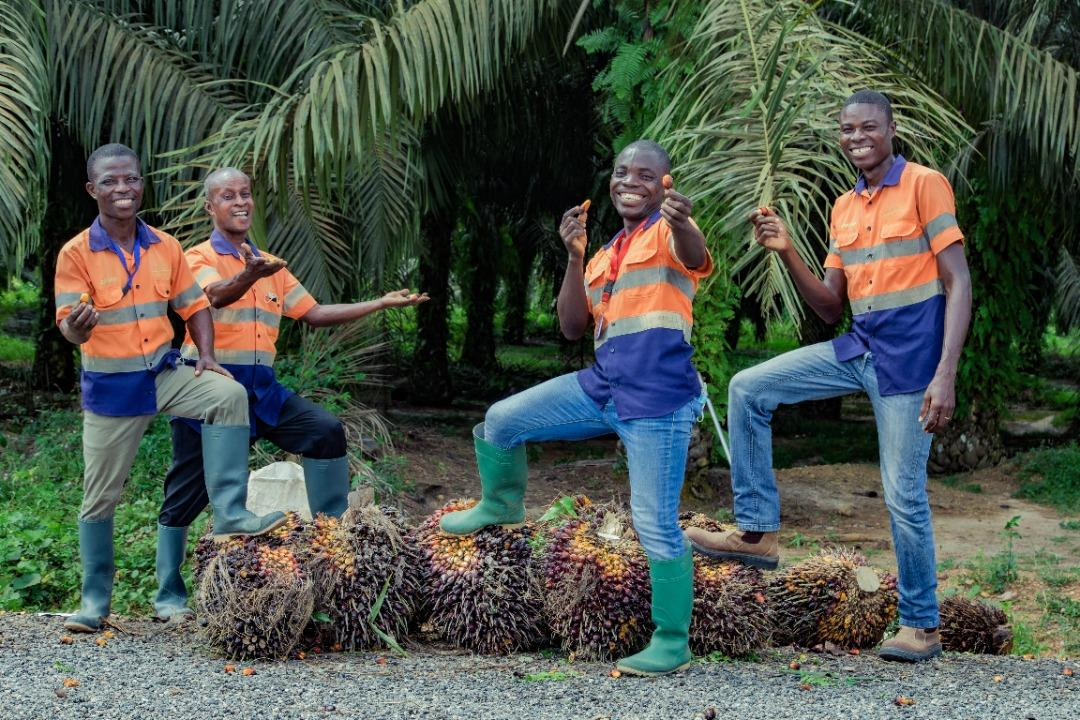
Golden Star Oil Palm Plantations Limited (GSOPP) was established in 2006 as a subsidiary of Golden Star Resources, a member of Chifeng Jilong Gold Group in pursuance of its corporate social responsibility.
GSOPP in partnership with the Traditional Authorities, with the support of the agro-forestry industry, promotes the development of oil palm plantations amongst our catchment communities, using the smallholder concept.
Through GSOPP, we continue to advance the businesses objectives of reducing poverty through employment generation and promoting wealth creation through sustainable agri-business.
Funded by Golden Star through US$1 per ounce of gold produced, to date we have directed over $3.2 million to this important initiative.
Sustainability In Action
The GSOPP social enterprise initiative has the credentials of bringing a new high revenue livelihood into some of Ghana’s most impoverished Districts. GSOPP is based in the ’Oil Palm Belt’ of Ghana, an area where oil palm is indigenous and self-propagates. Having been established on low production farmland, or former mined lands the plantations have not resulted in forest or Forest Reserve exploitation. With GSOPP unique approach to land acquisition, land tenure issues have been minimal, there has been no displacement, and landowners remain strongly supportive of ’their’ business. In over 16 years of operations GSOPP has experienced no labour or human rights related disruptions to its operations.
Having established a sustainable plantation business for over a decade, we are now focused on future organic growth and the evolution of GSOPP to incorporate down- stream processing through the establishment of a milling facility.
As these plans evolve, we expect to see ongoing benefits flowing from this important social enterprise endeavor as we remain focused on our objectives for poverty reduction through employment generation, and promotion of wealth creation through sustainable agri-business.
Golden Star and the Board of GSOPP have evaluated and determined the benefits of expansion of the business into downstream processing. The construction and operation of a 10 tonne per hour oil palm mill will significantly enhance GSOPP revenues and associated returns to farmers and host communities.
Golden Star and the Board of GSOPP have evaluated and determined the benefits of expansion of the business into downstream processing. The construction and operation of a 10 tonne per hour oil palm mill will significantly enhance GSOPP revenues and associated returns to farmers and host communities.
Local Processing to Add Value
GSOPP sells all fresh fruit bunches to the Wilmar BOPP organization, over 60km from the core GSOPP plantations. As a result, transport represents almost 15% of the farm- gate price for the fresh fruit bunches.
By developing a 10 tonne per hour oil palm mill, GSOPP will be able to process its fresh fruit bunches into crude palm oil which will be sold to Wilmar BOPP.
The expansion into local downstream processing will enhance the local value chain, increase revenues to famers and communities, and reduce costs associated with transportation.
The project evaluation includes the processing of outside purchased fruits (OPF). The estimated OPF volume is conservative and is based on field assessments of farms within a defined radius of the proposed mill site. The data has been validated by GSOPP and regional industry studies. These independent out-growers will also benefit directly from a reduction in transport costs.
Multiple Product Streams
In addition to the crude palm oil (CPO), additional by- product streams will be generated:
-
palm kernel oil (PKO) a saleable product.
-
palm kernel cake (PKC) a saleable product used for supplementary feeding of livestock.
-
palm kernel shells (PKS) a product that can be sold or used as fuel for the oil palm mill.
-
palm fibre which will be used as a compost for the palm plantations.
Options Assessments
Options assessments were conducted to determine processing methodology and mill sizing. In view of the size of the GSOPP plantations and independent smallholder farmers in the area, a 10 tonne per hour mill (medium scale) was identified as the optimum solution.
Initial designs and costing of the mill and construction have been developed by Solidarid and are estimated at US$3.7 million plus $0.3 million of working capital.
Oil Palm Supply and Demand
Of the major vegetable oils traded on the international market, palm oil is the most important and accounts for over half of the global import and export trade. In a 2019 report by The Guardian, worldwide annual production of palm oil according to the USDA from 2018 to 2019 was nearly 81.6 million tons. This shows that a significant proportion of people use products or items containing oil palm around the world. With its increasing use by food, health, cosmetics and biodiesel industries, global demand is projected to continue growing.
Globally, in 2021 the top importers of Palm Oil were India ($8.72B), China ($5.33B), Pakistan ($3.36B), Netherlands ($2.25B), and United States ($1.71B)
Within Ghana, the production of CPO is insufficient to meet internal demand. In 2021, Ghana imported $289M in Palm Oil, becoming the 37th largest importer of Palm Oil in the world.
Oil Extraction Rates (OER)
A CPO extraction rate of 20% has been assumed. Estate plantations in Ghana achieve 21% even with aging equipment. World class performance is recorded as over 25%. GSOPP uses only high yielding variety stock, the mill design incorporates equipment to maximize oil extraction, and clean water supply is readily available (oil washing and processing), and as such, an extraction rate of 20% is reasonable.
For conservatism, this Feasibility Study assumes slightly lower extraction rates for PKO (1.8%), PKC (2%) and PKS (6%) than are typically achieved by estate operations in Ghana.
Exchange Rate
Exchange rate has limited effect on the economics in that variables partially cancel each other out as the US $:GHc rate fluctuates. The largest cost input is FFB pricing which is limited in movement regardless of exchange rate. CPO price in a weakening dollar environment would probably rise in price in dollars and vice versa. The operating costs (plant and labour), which would be sensitive to exchange rate, are small inputs compared with the FFB cost.
CPO Price
The CPO price follows a cyclical pattern, however over the last 50 years has followed an upward trend. Using a conservative CPO price of $950/t the project has a positive NPV of $5.2M. The 10-year mean CPO price is $901/t.
Cost of Production and FFB Price
The major contributor to cost of CPO production is the purchase of the fresh fruit bunches. Within Ghana the FFB price has not varied significantly in US Dollar terms over the last ten years, varying within the range of $94-$126/mt and closely reflecting the CPO price.
Processing and maintenance costs are a small contributor to the costs. The oil palm mill will utilize by-products of the plantation and mill as fuel and as such, minimal power consumption is needed.
Other Product Streams
The additional product streams including palm kernel oil and cake, are by-products of the CPO production, and as such do not result in additional processing costs.
CPO Market
GSOPP has a long relationship of support with, and presently sells its FFB to Willmar BOPP, who have agreed to purchase the GSOPP mill products. Within the market context in Ghana there are several alternative purchasers available.
The following assumptions have been applied in the mill feasibility study:
Mill Capacity Analysis
Mill capacity
Hours per day
No. days per month
Total available capacity
Optimum utilization
10 t/hour
1 shift of 12 hours operation
22
31,680 tpa
26,928 tpa (85%)
Cost of Fresh Fruit Bunches
Cost of FFB
Operating cost per t CPO
US$121.60/t
US$171.97
Product1
Crude palm oil (CPO)
Palm kernel oil (PKO)
Palm kernel cake (PKC)
Palm kernel shell (PKS)
Price Forecast
US$950/t
US$1,000/t
US$18/t
US$14/t
OER
20.0%
1.8%
2.0%
6.0%
Other
Exchange rate
Corporation tax on profit
Interest on loan
11.0 GHc to US$
12.5%
10.0%
FFB Yield Analysis
Year 0 - 3
Year 4
Year 5
Year 6
Year 7
Year 8
Year 9
Year 10 -15
Year 16 - 19
Year 20 - 22
Year 23- 25
-
3.50
6.00
9.00
11.00
12.50
15.00
18.00
18.00
16.00
15.00
Assumptions
Revenue Forecast
Processing Costs
| Year |
Year 1 (2025) |
Year 2 (2026) |
Year 3 (2027) |
Year 4 (2028) |
Year 5 (2029) |
Year 6 (2030) |
Year 7 (2031) |
Year 8 (2032) |
Year 9 (2033) |
Year 10 (2034) |
|
|---|---|---|---|---|---|---|---|---|---|---|---|
| 2007 Planting | 120 | 2,160 | 2,160 | 1,920 | 1,920 | 1,920 | 1,800 | 1,800 | 1,800 | - | - |
| 2008 Planting | 100 | 1,800 | 1,800 | 1,800 | 1,600 | 1,600 | 1,600 | 1,500 | 1,500 | 1,500 | - |
| 2009 Planting | 33 | 594 | 594 | 594 | 594 | 528 | 528 | 528 | 495 | 495 | 495 |
| 2010 Planting | 100 | 1,800 | 1,800 | 1,800 | 1,800 | 1,600 | 1,600 | 1,600 | 1,600 | 1,500 | 1,500 |
| 2011 Planting | 33 | 594 | 594 | 594 | 594 | 594 | 594 | 528 | 528 | 528 | 495 |
| 2015 Planting | 50 | 900 | 900 | 900 | 900 | 900 | 900 | 900 | 900 | 900 | 900 |
| 2016 Planting | 100 | 750 | 900 | 900 | 900 | 900 | 900 | 900 | 900 | 900 | 900 |
| 2017 Planting | 85 | 1,063 | 1,275 | 1,530 | 1,530 | 1,530 | 1,530 | 1,530 | 1,530 | 1,530 | 1,530 |
| 2018 Planting | 58 | 638 | 725 | 870 | 1,044 | 1,044 | 1,044 | 1,044 | 1,044 | 1,044 | 1,044 |
| 2019 Planting | 7 | 63 | 77 | 88 | 105 | 126 | 126 | 126 | 126 | 126 | 126 |
| 2020 Planting | 50 | 300 | 450 | 550 | 625 | 750 | 900 | 900 | 900 | 900 | 900 |
| 2021 Planting | 215 | 753 | 1,290 | 1,935 | 2,365 | 2,688 | 3,225 | 3,870 | 3,870 | 3,870 | 3,870 |
| 2022 Planting | 101 | - | 354 | 606 | 909 | 1,111 | 1,263 | 1,515 | 1,818 | 1,818 | 1,818 |
| 2023 Planting (Proposed) | 50 | - | - | 175 | 300 | 450 | 550 | 625 | 750 | 900 | 900 |
| 2024 Planting (Proposed) | 25 | - | - | - | 88 | 150 | 225 | 275 | 313 | 375 | 450 |
| 2025 Planting (Proposed) | 25 | - | - | - | - | 88 | 150 | 225 | 275 | 313 | 375 |
| 2026 Planting (Proposed) | 600 | - | - | - | - | - | 2,100 | 3,600 | 5,400 | 6,600 | 7,500 |
| DOPP-Bogso/Prestea | 800 | 12,000 | 12,000 | 12,000 | 12,000 | 12,000 | 12,000 | 12,000 | 12,000 | 12,000 | 12,000 |
| TOTAL FFB AVAILABLE | 2,502 | 23,414 | 24,919 | 26,262 | 27,274 | 28,178 | 31,035 | 33,466 | 35,749 | 35,299 | 34,803 |
| Mill Capacity Utilisation | 87% | 93% | 98% | 101% | 105% | 115% | 124% | 133% | 131% | 129% | |
| CPO Production (t) | 4,683 | 4,984 | 5,252 | 5,455 | 5,636 | 6,207 | 6,693 | 7,150 | 7,060 | 6,961 | |
| PKO Production (t) | 421 | 449 | 473 | 491 | 507 | 559 | 602 | 643 | 635 | 626 | |
| PKC Production (t) | 468 | 498 | 525 | 545 | 564 | 621 | 669 | 715 | 706 | 696 | |
| PKS Production (t) | 1,405 | 1,495 | 1,576 | 1,636 | 1,691 | 1,862 | 2,008 | 2,145 | 2,118 | 2,088 | |
| REVENUE (US$) | Year 1 | Year 2 | Year 3 | Year 4 | Year 5 | Year 6 | Year 7 | Year 8 | Year 9 | Year 10 | |
| Revenue from CPO | 4,448,660 | 4,734,515 | 4,989,685 | 5,181,965 | 5,353,820 | 5,896,555 | 6,385,540 | 6,792,215 | 6,706,715 | 6,612,570 | |
| Revenue from PKO | 421,452 | 448,533 | 472,707 | 490,923 | 507,204 | 558,621 | 602,388 | 643,473 | 635,373 | 626,454 | |
| Revenue from KPC | 8,514 | 9,061 | 9,550 | 9,918 | 10,247 | 11,285 | 12,169 | 12,999 | 12,836 | 12,656 | |
| Revenue from PKS | 19,157 | 20,388 | 21,487 | 22,315 | 23,055 | 25,392 | 27,381 | 29,249 | 28,881 | 28,475 | |
| Total Revenue | 4,897,783 | 5,212,497 | 5,493,428 | 5,705,120 | 5,894,325 | 6,491,853 | 7,000,479 | 7,477,936 | 7,383,804 | 7,280,155 | |
| COSTS (US$) | Year 1 | Year 2 | Year 3 | Year 4 | Year 5 | Year 6 | Year 7 | Year 8 | Year 9 | Year 10 | |
| Cost of FFB | (2,847,142) | (3,030,090) | (3,193,398) | (3,316,458) | (3,426,445) | (3,773,795) | (4,069,466) | (4,347,018) | (4,492,298) | (4,232,045) | |
| Factory processing cost | 3% | (146,933) | (156,375) | (164,803) | (171,154) | (176,830) | (194,756) | (210,014) | (224,338) | (221,514) | (218,405) |
| Factory maintenance cost | 5% | (244,889) | (260,625) | (274,671) | (285,256) | (294,716) | (324,593) | (350,024) | (373,897) | (369,190) | (364,008) |
| General overheads & admin | (494,538) | (494,538) | (494,538) | (494,538) | (494,538) | (494,538) | (494,538) | (494,538) | (494,538) | (494,538) | |
| Total Processing Cost | (3,733,503) | (3,941,627) | (4,127,411) | (4,267,405) | (4,392,529) | (4,787,681) | (5,124,042) | (5,439,790) | (5,377,540) | (5,308,995) | |
| Mill Investments/Repayments | |||||||||||
| REPAYMENTS (US$) | Year 1 | Year 2 | Year 3 | Year 4 | Year 5 | Year 6 | Year 7 | Year 8 | Year 9 | Year 10 | |
| Processing plant cost | 4,000,000 | - | - | - | - | - | - | - | - | - | |
| Principal outstanding | 4,000,000 | 3,600,000 | 3,200,000 | 2,800,000 | 2,400,000 | 2,000,000 | 1,600,000 | 1,200,000 | 800,000 | 400,000 | |
| Interest payment | 400,000 | 360,000 | 320,000 | 280,000 | 240,000 | 200,000 | 160,000 | 120,000 | 80,000 | 40,000 | |
| Principal payment | 400,000 | 400,000 | 400,000 | 400,000 | 400,000 | 400,000 | 400,000 | 400,000 | 400,000 | 400,000 | |
| Total payment due | 800,000 | 760,000 | 720,000 | 680,000 | 640,000 | 600,000 | 560,000 | 520,000 | 480,000 | 440,000 | |
Free Cash Flow
Mill project evaluation demonstrates positive operating and net cash flows, with all coverage ratios satisfied.
Net Present Value (NPV)
The NPV of post tax cash flows at a 10% discount rate is US$5.2 million.
Project Internal Rate of Return (IRR)
The Project internal rate of return after tax is 33.8%.
Payback
The payback period after tax is 3.08 years.
Evaluation Summary
The post tax NPV, IRR and payback demonstrate the project’s positive feasibility.
Under an interest free loan scenario, the project financials are even more positive, with significant and direct benefits to flow to GSOPP and host communities. With a zero interest loan the NPV increases to $11.6 million.
| Scenario | NPV (US$M) |
|---|---|
| Base case (10% interest loan) | 5.2 |
| Zero interest loan case | 11.6 |
| Discount rate | Project NPV |
|---|---|
| 0% | $ 11,632,250 |
| 5% | $ 7,822,165 |
| 10% | $ 5,236,644 |
| 15% | $ 3,427,770 |
| Project IRR | 33.8% |
|---|
The project is expected to generate significant benefits to GSOPP and host communities, with a positive impact on livelihoods and the local economy.

| Details | UOM |
Start 2024 |
Year 1 2025 |
Year 2 2026 |
Year 3 2027 |
Year 4 2028 |
Year 5 2029 |
Year 6 2030 |
Year 7 2031 |
Year 8 2032 |
Year 9 2033 |
Year 10 2034 |
|---|---|---|---|---|---|---|---|---|---|---|---|---|
| Revenue | $ | 4,897,783 | 5,212,497 | 5,493,428 | 5,705,120 | 5,894,325 | 6,491,853 | 7,000,479 | 7,477,936 | 7,383,804 | 7,280,155 | |
| Cost of FFB | $ | (2,847,142) | (3,030,090) | (3,193,398) | (3,316,458) | (3,426,445) | (3,773,795) | (4,069,466) | (4,347,018) | (4,292,298) | (4,232,045) | |
| Gross Earnings | $ | 2,050,641 | 2,182,408 | 2,300,030 | 2,388,663 | 2,467,880 | 2,718,058 | 2,931,013 | 3,130,919 | 3,091,507 | 3,048,110 | |
| FFB % of Revenues | 58.1% | 58.1% | 58.1% | 58.1% | 58.1% | 58.1% | 58.1% | 58.1% | 58.1% | 58.1% | ||
| Factory processing cost | $ | (146,933) | (156,375) | (164,803) | (171,154) | (176,830) | (194,756) | (210,014) | (224,338) | (221,514) | (218,405) | |
| Factory maintenance cost | $ | (244,889) | (260,625) | (274,671) | (285,256) | (294,716) | (324,593) | (350,024) | (373,897) | (369,190) | (364,008) | |
| General overheads & admin | $ | (494,538) | (494,538) | (494,538) | (494,538) | (494,538) | (494,538) | (494,538) | (494,538) | (494,538) | (494,538) | |
| Total Operating Expenses | $ | (886,361) | (911,538) | (934,012) | (950,948) | (966,084) | (1,013,886) | (1,054,576) | (1,092,773) | (1,085,242) | (1,076,950) | |
| Operating Expenses % of Revenue | 18.1% | 17.5% | 17.0% | 16.7% | 16.4% | 15.6% | 15.1% | 14.6% | 14.7% | 14.8% | ||
| EBITDA | $ | 1,164,280 | 1,270,870 | 1,366,018 | 1,437,715 | 1,501,796 | 1,704,172 | 1,876,437 | 2,038,146 | 2,006,264 | 1,971,160 | |
| Depreciation | $ | (370,000) | (370,000) | (370,000) | (370,000) | (370,000) | (370,000) | (370,000) | (370,000) | (370,000) | (370,000) | |
| Interest on Loan | $ | (400,000) | (360,000) | (320,000) | (280,000) | (240,000) | (200,000) | (160,000) | (120,000) | (80,000) | (40,000) | |
| PBT | $ | 394,280 | 540,870 | 676,018 | 787,715 | 891,796 | 1,134,172 | 1,346,437 | 1,548,146 | 1,556,264 | 1,561,160 | |
| PAT | 344,995 | 473,261 | 591,515 | 689,251 | 780,322 | 992,400 | 1,178,132 | 1,354,628 | 1,361,731 | 1,366,015 | ||
| Free cash flow | ||||||||||||
| EBITDA | $ | 1,164,280 | 1,270,870 | 1,366,018 | 1,437,715 | 1,501,796 | 1,704,172 | 1,876,437 | 2,038,146 | 2,006,264 | 1,971,160 | |
| Corporate Tax | $ | (49,285) | (67,609) | (84,502) | (98,464) | (111,475) | (141,771) | (168,305) | (193,518) | (194,533) | (195,145) | |
| Investment in Mill Plant | $ | (3,700,000) | ||||||||||
| Working Capital | $ | 300,000 | ||||||||||
| Net Cash Flow | $ | (3,700,000) | 1,114,995 | 1,203,261 | 1,281,515 | 1,339,251 | 1,390,322 | 1,562,400 | 1,708,132 | 1,844,628 | 1,811,731 | 2,076,015 |
| NPV | $ | 5,236,644 | ||||||||||
| Year 1 | Year 2 | Year 3 | Year 4 | Year 5 | Year 6 | Year 7 | Year 8 | Year 9 | Year 10 | |||
| ICR | 2.0 | 2.91 | 3.53 | 4.27 | 5.13 | 6.26 | 8.52 | 11.73 | 16.98 | 25.08 | 49.28 | |
| DSCR | 1.2 | 1.51 | 1.74 | 1.98 | 2.21 | 2.46 | 2.99 | 3.54 | 4.16 | 4.46 | 4.81 |

Sensitivity analysis shows that the project is most sensitive to extraction rates, fresh fruit bunch price, and product prices.
Oil Extraction Rates (OER)
For conservatism, lower extraction rates have been assumed for all product streams than are typically achieved by estate operations in Ghana: 92% of typically achieved CPO, 90% of PKO, 67% of PKC and 85% of PKS.
Despite this, and even when modelled with a further 10% reduction in OER, the NPV of the project remains positive.
Fresh Fruit Bunch (FFB) Price
Within Ghana the FFB price has not varied significantly in US Dollar terms over the last ten years, varying within the range of $94-$126/t and closely reflecting the CPO price.
Product Prices
The crude palm oil (CPO) price follows a cyclical pattern but over the last 50 years has followed an upward trend despite the swings.
Using a conservative CPO price of $950 the project has a positive NPV of $5.2M. The 5-year mean CPO price is $1,238/t.
There is more upside potential than downside risk for this variable.

The GSOPP mill evaluation has been conducted on a conservative base case model excluding potential upside. There remains significant potential for this project in the terms of the following:
-
Assumed crude palm oil prices are lower than the last three years average price.
-
There remains the potential to attract more outside purchased fruits (OPF) to the mill business for additional profitability. Fruits grown within a 100km radius could be viably transported to the GSOPP mill.
-
Expansion of the GSOPP plantations beyond 2026 is not included despite land commitments by host communities.
-
Oil palm plantation is the agreed next land use in a number of current and active mining areas. Further plantation growth will be achieved as these sites are reclaimed.
-
All market projections are for growth in demand in crude palm oil as the product is increasingly used in food, health, cosmetics and biofuel industries. Presently Ghana is unable to meet its internal demand for crude palm oil.
-
The base case model has the mill operating for a single shift of operations, with potential to expand into double shift.
-
The GSOPP proposed mill is modular and can be scaled up to 20 tonne per hour for further expansion.
